
Assumptions
- You have a Telegraf service up and running on the same host you want to monitor system services from
- You have a InfluxDB instance up and running, receiving data from the previously mentioned Telegraf service
- You have a Grafana instance up and running, making it possible to visualize data from InfluxDB
- In this example, the Nginx web server will be monitored
Install Sysdweb
Follow the installation instructions provided in the repository’s README file.
Then save the sysdweb.conf file to /etc/sysdweb/sysdweb.conf:
sudo mkdir /etc/sysdweb
sudo wget https://raw.githubusercontent.com/ogarcia/sysdweb/master/sysdweb.conf -O /etc/sysdweb/sysdweb.conf
Create a Systemd service for Sysdweb
Save the following to /lib/systemd/system/sysdweb.service:
[Unit]
Description=Control systemd services through Web or REST API
Documentation=https://github.com/ogarcia/sysdweb
After=network.target
Requires=dbus.socket

[Service]
ExecStart=/usr/local/bin/sysdweb -c /etc/sysdweb/sysdweb.conf
Restart=on-failure

[Install]
WantedBy=multi-user.target
Start the new Sysdweb service:
sudo systemctl daemon-reload
sudo systemctl enable --now sysdweb
Check if the service is working:
$ curl -u 'sysdweb:supersecretpassword' 127.0.0.1:10080/api/v1/ngx/status
{"status": "active"}
Create a user for Sysdweb
There are multiple ways of interacting with Sysdweb (just review the config file), but this time I will be using the system user method:
sudo adduser sysdweb
Prepare Telegraf
Add the following block to /etc/telegraf/telegraf.conf:
[[inputs.http_response]]
  urls = ["http://localhost:10080/api/v1/ngx/status"]
  response_timeout = "5s"
  username = "sysdweb"
  password = "supersecretpassword"
  response_string_match = "{\"status\": \"active\"}"
Apply changes to the Telegraf configuration:
sudo systemctl restart telegraf
Let Grafana do the rest
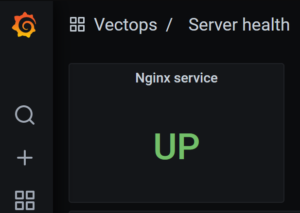
After adding a new panel and selecting InfluxDB as data source, with such a simple query you will see a “Success” string (by picking Stat as visualization type) in your panel:
SELECT result_type FROM http_response WHERE server =~ /ngx/
At this point, by adding a value mapping from the string “success” to “UP”, you will then be able to monitor the current status of the Nginx service from your host at a glance.
In the same way, by adding another value mapping from the string “response_string_mismatch” to “KO”, it will become pretty clear that something wrong is taking place when Nginx goes down.
Final notes
I know there is a Telegraf plugin called inputs.systemd_units that could directly cover the need described in this article, but finding out that Sysdweb could be effectively used for the same purpose was hella fun.
Finally, shout out to Óscar García for bringing this useful tool to life!
Cheers!